Your company will naturally feel and see the results of a well-designed SEO campaign through the increase in leads and social chatter.
Being able to quantify that feeling into visually compelling data instills trust and allows for greater flexibility with future campaigns.
Here’s how to measure SEO success with Google Data Studio.
Define Success
There needs to be a clear, measurable goal.
What defines SEO success for every company is going to differ however there are a few solid KPIs that most service based businesses focus on:
- Lead generation.
- Customer engagement.
- Brand visibility.
This article is going to focus on lead generation because ultimately that is what makes money.
Setting Up Goals
Lead Generation
Now that you have defined your content’s key performance indicators – or what you determine to be a success – we need to record those goal completions.
Our team prefers to use a combination of Google Analytics, Google Tag Manager and Data Studio to create interactive reports anyone can view at any time.
To measure lead generation, you must set up a custom goal for each successfully submitted form.
The most obvious method to collect data is a unique thank you page for a unique form fill.
Google Analytics does a great job explaining how to set up destination tracking in this documentation.
Creating a New Goal in Google Analytics
- Sign in to Google Analytics.
- Click Admin.
- Navigate to the desired View:
- Should be filtering out company IPs here.
- In the VIEW column, click Goals.
- Click + NEW GOAL
- Select Custom from the list of options.
- Click Next Step.
- Select the goal Type: Destination.
- Destination: Equals to “/campaignname_thankyou”
- Edit this to your campaign’s unique thank you page.
- Value: Assign a monetary value for how much each lead is worth.
- Click Save.
Google Tag Manager can be used to measure more complicated touchpoints, like call schedulers or when destination tracking is not possible.
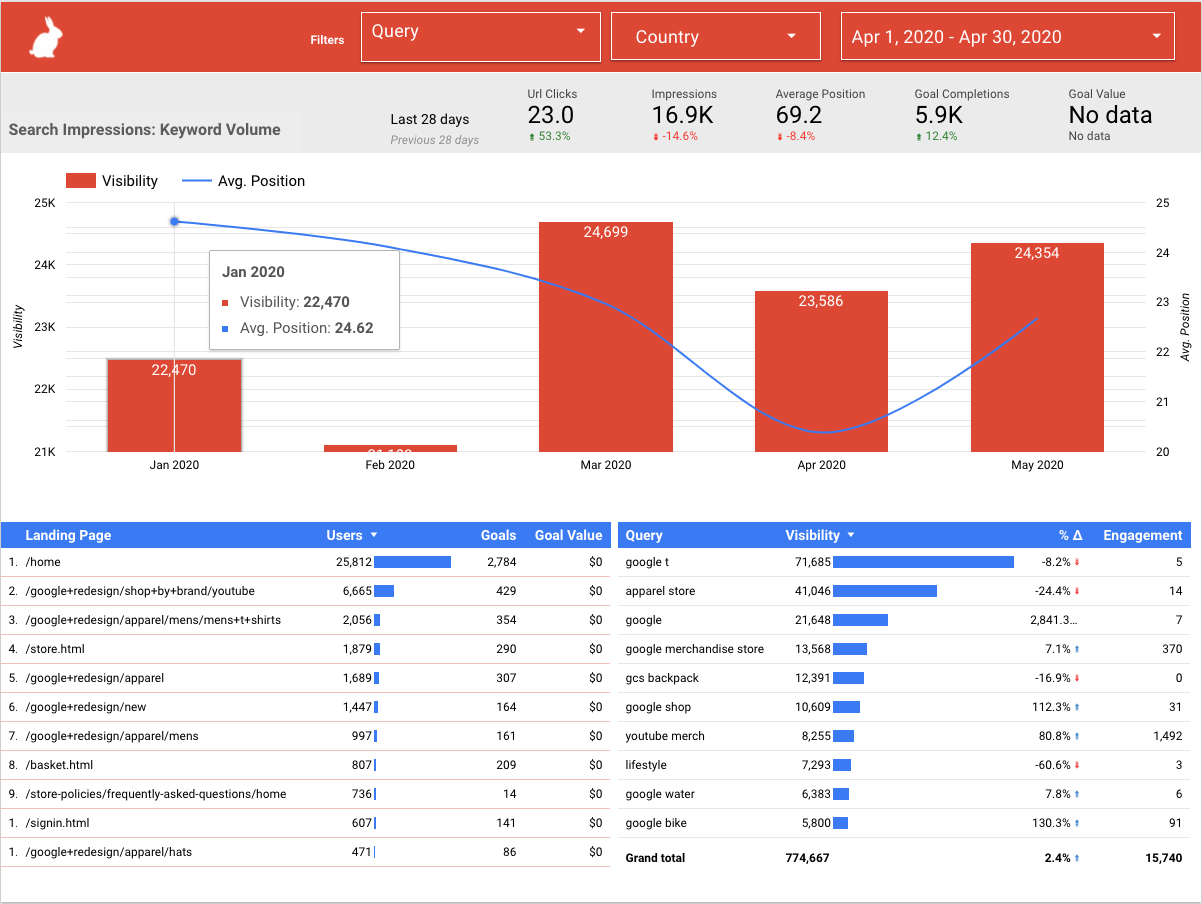
Visualize the Data
Visualize the data with Google Data Studio, this is a free tool available by Google that is easy to use, customize and share.
Because we have laid out conversion tracking in the previous steps, we can now turn this hard data into an appealing interactive report that team members can access 24/7.
Making the hard-earned increase in organic brand visibility, user engagement, and/or leads generated easy to convey and understand.
This tip is going to stay focused on proving the ROI of an SEO campaign. So, lead generation.
The full step-by-step guide including Brand Visibility and Organic Audience Engagement metrics is available in the full article posted on SEJ.
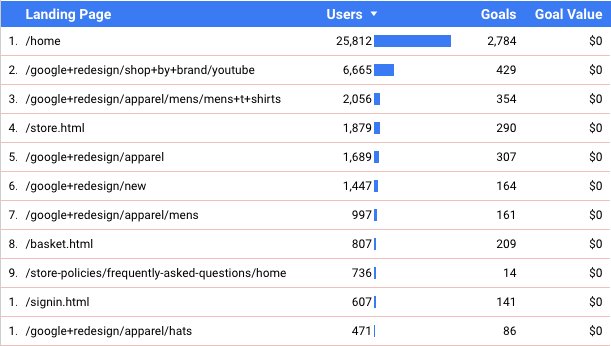
Bottom left table is where our previous work setting up goals (KPIs) in Google Analytics and assigning values comes into play.
The lead generation table displays:
- How many users are navigating to the new content pages.
- How many goals are completed per page.
- What the monetary value of that content campaign is.
Note: If this is not new content you will be notating the difference in goals and page/goal value after edits are made.
It gets even cooler when you start adding MCF assisted conversions to show which LPs have contributed to all conversions.
SEO Return on Investment
ROI for search engine optimization seems hard because value of edits and new campaigns can stretch over months and the leads generated continue long after.
I promise it’s a lot easier than you think. The key is to work with your client or partner to not only define goals but assign a value to that goal.
As an SEO provider, your work should be organized with a planned strategy. Roll out your edits in bundles and measure the monetary effect.
Do not work through a “checklist” and throw darts at a wall until something sticks. Understand what will stick, know the probability and risk, before spending a client’s money.
Return on investment is calculated by dividing the goal value by your SEO costs + project management: strategy, developers, editors, management, etc.
SEO Investment
First, you need to know the cost of your investment. Add up the expense for each step involved in creating, launching, and reporting on an SEO campaign.
For example:
- $1,500 site audit
- $1,500 campaign #1 strategy
- $3,500 strategy implementation
- $500 custom reporting
Total SEO Investment = $7,000 for Campaign 1
Now, let’s calculate the return.
Return on SEO
Jot down the average percent of leads (or downloads) that turn into a sale. And, what the lifetime value of that partnership is.
In other words, what is the average consumer’s profit margin over the course of their relationship with your company?
Number of Customers Example:
- Campaign average monthly traffic: 5,000
- Conversion rate to lead: 2%
- 100 leads
- Closing conversion rate (lead to sale): 2%
- Customers attributed to the campaign per month: 2
Customer Lifetime Value Example:
- Average customer contract is $90,000
- X average duration (3 years) = $270,000
- Profit margin per client is 15%
- Average customer lifetime value is $40,500
Projected Profit:
- CLV x # of new customers = $81,000
SEO ROI Formula
Search Engine Optimization ROI can be calculated by multiplying customer lifetime value by the number of new customers per month minus cost of investment divided by cost of investment.
Example Continued:
($40,500 x 2) – $7,000 / $7,000
($81,000 – $7,000) / $7,000
$71,000 / $7,000 = 10.14
The ROI for SEO Campaign 1 example is 1,014.28%.
If you are making edits that affect pages that are currently live on the site, be sure to calculate the ROI of these pages before and after your edits so you can show the % lift.